 Requirements of Assign1
Requirements
Instructions
Instructions
Requirements Analysis
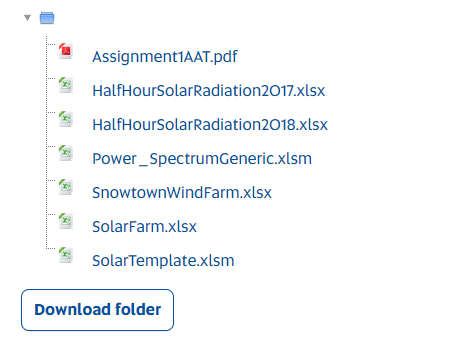
For this question you will need the files from the website named
a. HalfHourSolarRadiation2017.xlsxb. HalfHourSolarRadiation2018.xlsxc. PowerSpectrumGeneric.xlsmd. SolarTemplate.xlsmThe tasks for this question are listed below.
- Take the solar radiation data from File
a, and copy it into Filec, and run the power spectrum tool to find out which frequencies are important. - Use File
cto find the Fourier series model for the seasonality.Info
Note that the Template is designed for hourly data. You will have to make some adjustments to use it for half hourly data plus change the relevant frequencies if necessary.
- Take the difference between the data and the Fourier model - the residuals - and take them to Minitab and find the best ARMA(p,q) model.
- Use the ARMA model to forecast one step ahead for the residuals and add that to the Fourier series model to get the full one step ahead forecast.
- Use the error metrics defined below to evaluate the model.
- Use the models you have developed for 2017 to see how they perform for the 2018 data, the out of sample data. Comment on the differences in the error metrics.
The Normalised Mean Bias Error (NMBE) is defined by taking the difference between the data
Tips
Note that for solar radiation, we only do the calculation for solar elevation greater than or equal to 10 degrees. That is why I included the elevation data.
We also define the Normalised Mean Absolute Error (NMAE)
- Take the solar radiation data from File
For this question you will need the files
a. SolarFarm.xlsxb. PowerSpectrumGeneric.xlsmc. SolarTemplate.xlsmIn File
ais solar farm output in MegaWatts(MW) for every five minutes for a year.- You are to use the power spectrum to decide on the necessary frequencies, and
- then alter the File
cto find the Fourier series model. - Then calculate the residuals and find their ARMA model.
- Then calculate the one step ahead forecast and evaluate the error metrics for all values of output greater than zero.
The file on the website SnowtownWindFarm.xlsx has a one year of half hour output from a wind farm in South Australia.
- Use the power spectrum file from above to show that there is no significant seasonality in the data.
- You are now to Compare the best
AR(p)model with the bestARMA(p,q)model that you can find. Use the error metrics for your comparison. - Is there a difference in the number of parameters to estimate in the two models? If so, is it worth it to use the one with extra parameters?

