 Prac: Synthetic Generation
Part 1: How to generate Random data with Excel
Generate Normal Distribution Ramdom Values
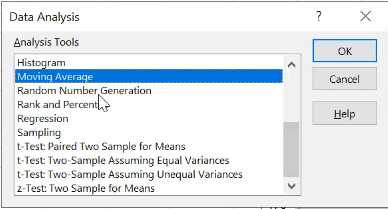
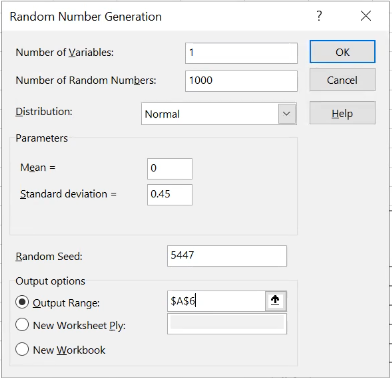
The following pictures show how to generate 1000 normal distribution data.
Step 1

Step 2
Step 3
Please to evaluation the distribution of the data

Generate Realisation
B6 = A6
B7 = $D$1*B6+A7
Fill other cells follow the fomula of B7
Part 2: Lower and Upper Bounds
The whole solar dataset need to seperate into two parts for forecasting. The first part is the FS Model that has been given in column B, then using AR(1) model to forecast the residuals that store in column C. The parameter of AR(1) is given in L1.
The sum of the two models form the final model. The next step is to construct the lower and upper bounds to estimate the final model. The lower bound equals final model substract a specified value, and the upper bound equals final model add the same value. Then to using the bounds to estimate whether the real value been covered by the final model.
According to the the content above, the formulas in excel should be like below:
C2 = A2- B2

D3 = C2*$J$1

E2 = B2 + D2

F2 = E2-$L$5*$L$6
G2 = E2+$L$5*$L$6

H2 = AND(A2>F2,A2<G2)
I2 = IF(H2=TRUE,1,0)
A: is the solar original dataset.
B: is the forcasting from FS Model component
C: is the residuals.
D: is the result from AR(1) model.
E: is the combination of tow models.
F: is the lower bound based on the final result.
G: is the upper bound based on the final bounds.
H: whether the original data locates the range of the bounds.
I: 1 IF H equals TRUE, else 0.
L1: the coefficient of AR(1) model.
L5: is the score of confidence.
L6: is the standard deviation from training test.
Uniform to resample
Step 1: Using Random generation to generate a series Uniform distributed data as the probability to resample data from noises.

Step 2: Resample the noises using the probabilities
E2=PERCENTILE.INC(C$2:C$366,D2)Step 3: Using AR(1) to model the new Noises
F2 = E2
F3 = =$J1*F2+E3
Step 4: To form the final model
G2 = B2+F2Step 5: Visualize the final result

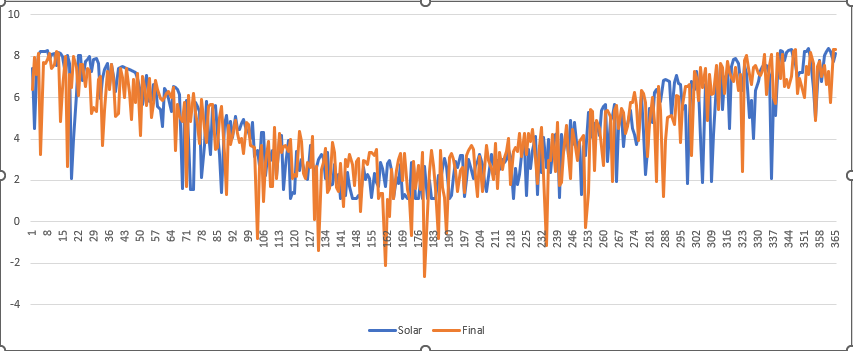
Step 6: To compare the result from different uniform data
- generate multi uniform data as the probabilities
- Store the final models.
- Comapre the statistical information of the final models.
