 Prac: Rainfall (GAMMA)
Rainfall Modelling (W6)
Part1: Getting Gamma model parameters
The instructions
instructions
- Take the file called
PoorakaMonthlyFit.xls. It contains a sheet that shows the fitting procedure using Likelihood to fit a Gamma Distribution to data for the 87 years for June for Pooraka. Try matching moments to see what you get for the parameters as well. - You are to repeat this for May-September. Check out both the methods and apply to the other months. Then see about in each case.
- Take the file called
Setting Parameters
'The likelihood fomula
B3 = (E$2-1)*LN(A3)-A3/$E$3-$E$2*LN($E$3)-$E$4

'initialize the α and β
D1 = 1
D2 = 2
Other cells please refer to the picture below to fill.

Using the solver to maximize the sum of likelihood. Please set the parameter follow the picture below.

- Note:
Info
Please note, it is necessary add a constraint that
After maximizing, the result will be like the picture below.

Part2: Getting gamma distribution data
- The instructions
instructions
- For synthetic generation, it is a little more complicated but not much. I have gone to Data Analysis and then Random Number Generation. Pick 1 variable, and 3000 values (I did 200 just to make sure the file was small), Uniform Distribution, and then the range is [0.0001,0.9999] so we don’t get any odd values in the synthetic generation. The Output Range starts in
A5. InB5, you will see I have the formula=GAMMAINV(A5,$D$1,$D$2). That selects the rainfall total from theGamma Distributionwith our parameter estimates that corresponds to the probability inA5. Copy that down for all the values in column A. Repeat for all months. Then, put the synthetic monthly totals in adjoining columns in a new sheet. Find the seasonal totals for all 3000 cases. Put the columns of historical data side by side in the same sheet. Once again find the totals. Then using the Histogram menu item on Data Analysis, compare the two sets of totals – you will need to use the cumulative probability option. - Markov Equilibrium Vector. In cells
A1:B2put the values of the transition matrix for the daily rainfall, 0.73, 0.27, 0.36, 0.64 from the workshop. The next part is tricky so follow carefully. Highlight cellsD1:E2, and enter the formula=mmult(A1:B2,A1:B2)and hold down the shift and control keys and then hit enter. You will get the transition matrix squared. Square this result in cellsG1:H2, using the same technique. Repeat until you get convergence. How many powers of the matrix did you get to for convergence? Now calculate the equilibrium vector by using the procedure given in the workshop and compare results.
- For synthetic generation, it is a little more complicated but not much. I have gone to Data Analysis and then Random Number Generation. Pick 1 variable, and 3000 values (I did 200 just to make sure the file was small), Uniform Distribution, and then the range is [0.0001,0.9999] so we don’t get any odd values in the synthetic generation. The Output Range starts in
Getting histogram
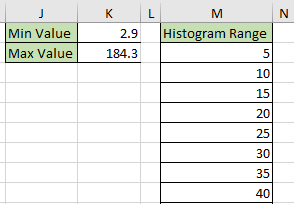
Step 1: Get max and min of the data.
Step 2: Construct the bins data of the data.
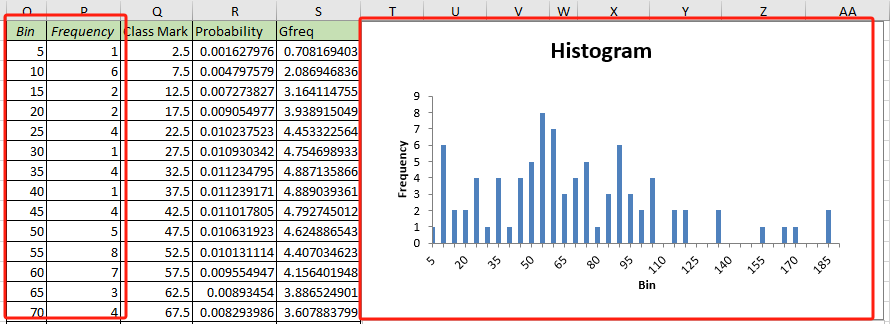
Step 3: Using the histogram tool to generate frequencies.


Geting GAMMA.DATA
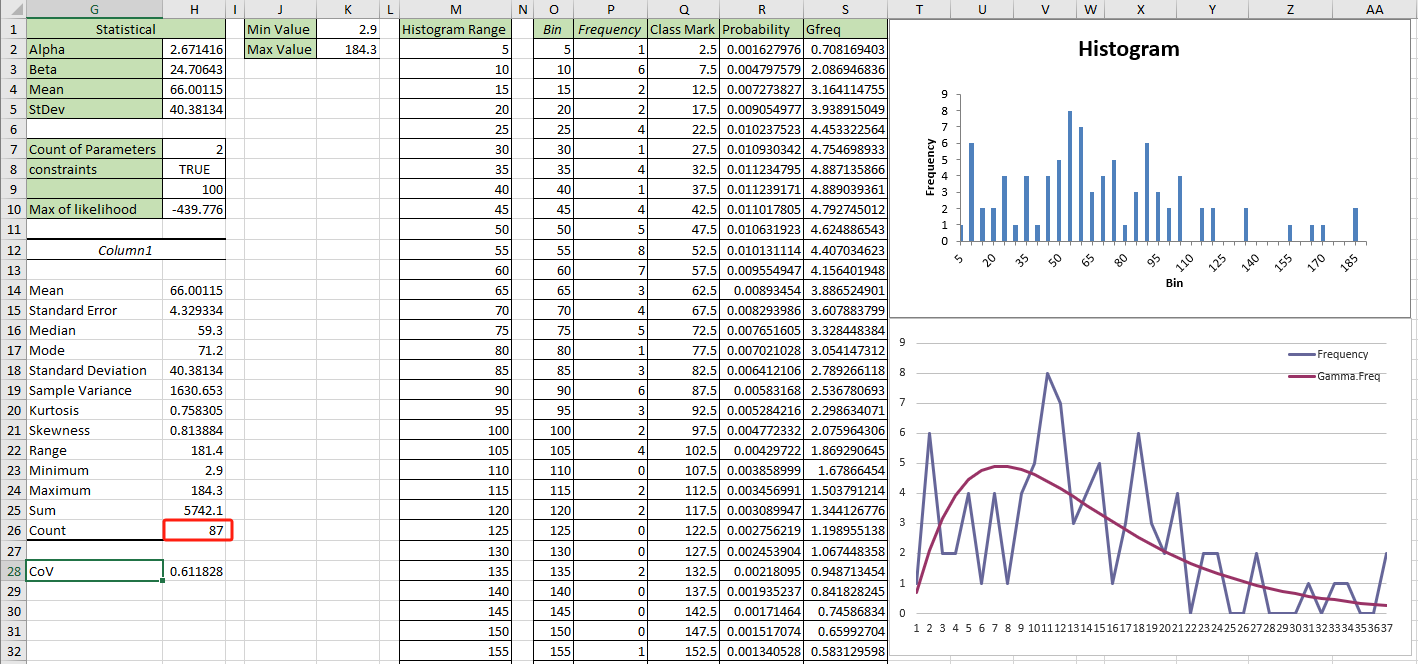
Step 1: Constructing data
Q2 = O2/2
Q3 = Q2+5
R2 = GAMMA.DIST(Q2,$E$2,$E$3,FALSE())
S2 = R2*$H$26*5
Step 2: Visualize the frequency and Gamma frequency
