
Introduction
This is your second assessable exercise which is part of the continuous assessment. This exercise is worth 10 points of your final grade.
For this exercise, you will work with the same supermarket data you used in Assignment 1. You will use a full 3-year history and all customers to have more information for the modelling.
Selling any product is a risky proposition for a supermarket. If the supermarket has too much stock – unsold products will spoil and go to rubbish bin, so the supermarket will lose money. If the supermarket has not enough stock, then customers might not be able to buy, and the supermarket loses an opportunity to earn money. So, the supermarket needs to have “enough stock” or the optimal amount of stock. We will revisit and solve this problem later in the course.
For now, you should analyse the supermarket operations in terms of selling ice creams. It is very easy to identify these purchases in the data: value "ICE CREAMS AND ICE CONFECTIONS" in the variable "Commodity_Name". Obviously, there are different package sizes for ice cream – we ignore that complexity and just do summation for "Quantity_Sold". So, one item of ice cream product equals to any other item of ice cream product regardless their weight. Be aware: you do analysis on item sales, not dollar sales.
There is nothing worse than not being able to buy an ice cream when you crave for it. You will consider a daily risk of an extremely high demand and running out of ice cream as a result. You will run analysis of risks at 5% and 1% level.
Tasks for Completion
Prepare a brief report for the following questions:
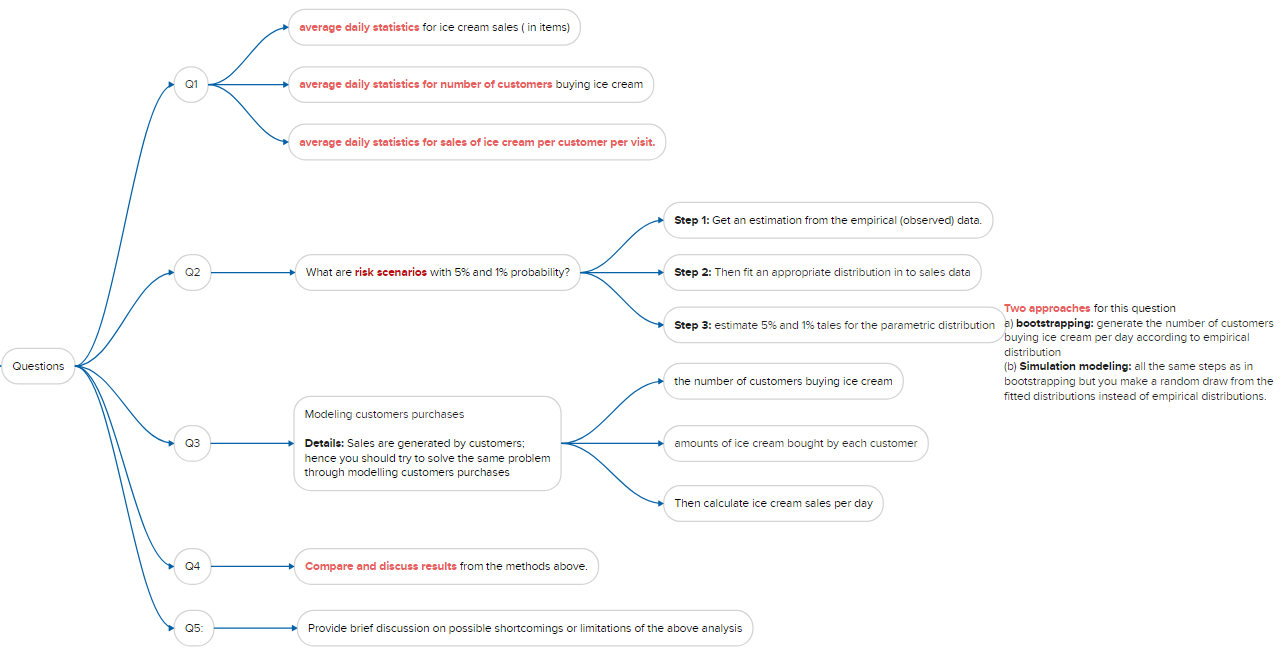
- What are average daily statistics for ice cream sales (in items), number of customers buying ice cream and sales of ice cream per customer per visit.
- What are risk scenarios with 5% and 1% probability? Get an estimation from the empirical (observed) data. Then fit an appropriate distribution in to sales data and estimate 5% and 1% tales for the parametric distribution.
- Sales are generated by customers; hence you should try to solve the same problem through modelling customers purchases, that is, the number of customers buying ice cream and amounts of ice cream bought by each customer. Then calculate ice cream sales per day.
Hint: As you don’t do analysis on the customer level, you don’t need customers ID and you don’t worry about “generic” cards. You group data by Receipt ID and date/time, to get a unique shopping trip.
You will use two approaches for this question:
- (a) bootstrapping and
- (b) modelling.
- (a) Bootstrapping:
- Step 1: generate the number of customers buying ice cream per day according to empirical distribution, e.g., X customers.
- Step 2: Then sample at random individual sales of ice cream for each of X customers from the empirical distribution of observed ice cream sales. Summation will give you total “possible” ice cream sales for a day.
- Step 3: Repeat generating the number of customers buying ice cream and random sampling for ice cream sales for a significant period of time, say for 10 years, and analyse resulted distribution of total ice cream sales and in particular 5% and 1% probability of the “best” or “worst” case scenario.
- (b) Simulation modelling: all the same steps as in bootstrapping but you make a random draw from the fitted distributions instead of empirical distributions.
- Compare and discuss results from the methods above.
- Provide brief discussion on possible shortcomings or limitations of the above analysis.
Submission Requirements
Exercise 2 due date is Sunday, 12 May 2024, 11:59 PM. Please start this exercise early and finish it early too. There is 10-point late submission penalty for each day or part of it beyond the deadline.
You must submit one file with your report in MS Word or PDF format. Report should be brief, as no one like reading long report. Also, this is a small exercise only – there should be a brief report. While the list of questions might look intimidating, these questions do not require a lot of writing. But they do require some graphs to show distributions and numerical summaries.
You don’t need to submit programming code; however, you should retain copies of all assignment computer files used during development of the solution to the assignment. These files must remain unchanged after report submission, for the purpose of checking if required.
If you have any questions – feel free to ask on the forum. You can and probably should discuss this exercise with me and other students. However, you should remember this is an individual assessment and should reflect your own work. Remember about academic integrity.
Reference documents
- Scenario Analysis in Python: Advanced Investment Risk Analysis
- Monte Carlo Simulation in Python: Advanced Investment Risk Analysis
- Power of Monte Carlo Simulation in Risk Analysis
- Python for Risk Analysis: A Comprehensive Guide
- Risk Analysis: Risk Analyst’s Guide
- A Comprehensive Guide to Risk Analysis in Financial Domain