Information came from Srecko in Discord channel HS.data-daily-update at 2:04pm 27 June 2024.
This is the notes for paper "Which log variables significantly predict academic achievement? A systematic review and meta-analysis".
Abstract
Technologies and teaching practices can provide a rich log data, which enables learning analytics (LA) to bring new insights into the learning process for ultimately enhancing student success. This type of data has been used to discover student online learning patterns, relationships between online learning behaviors and assessment performance. Previous studies have provided empirical evidence that not all log variables were significantly associated with student academic achievement and the relationships varied across courses. Therefore, this study employs a systematic review with meta-analysis method to provide a comprehensive review of the log variables that have an impact on student academic achievement. We searched six databases and reviewed 88 relevant empirical studies published from 2010 to 2021 for an in-depth analysis. The results show different types of log variables and the learning contexts investigated in the reviewed studies. We also included four moderating factors to do moderator analyses. A further significance test was performed to test the difference of effect size among different types of log variables. Limitations and future research expectations are provided subsequently.
Note
What's the task of this paper:
This study employs a systematic review with meta-analysis method to provide a comprehensive review of the log variables that have an impact on student academic achievement.
What did the authors do
- Searching six databases and reviewed 88 relevant empirical studies published from 2010 to 2021 for an in-depth analysis.
- We also included four moderating factors to do moderator analyses.
- A further significance test was performed to test the difference of effect size among different types of log variables.
Practitioner notes
What is already known about this topic
- Significant relationship between active engagement in online courses and academic
achievement was identified in a number of previous studies. - Researchers have reviewed the literature to examine different aspects of applying
LA to gain insights for monitoring student learning in digital environments (eg, data
sources, data analysis techniques).
What this paper adds
- Presents a new perspective of the log variables, which provides a reliable quantitative
conclusion of log variables in predicting student academic achievement. - Conducted subgroup analysis, examined four potential moderating variables and
identified their moderating effect on several log variables such as regularity of study
interval, number of online sessions, time-on-task, starting late and late submission. - Compared the effect of generic and course-specific, basic and elaborated log
variables, and found significant difference between the basic and elaborated.
Implications for practice and/or policy
- A depth of understanding of these log variables may enable researchers to build
robust prediction models. - It can guide the instructors to timely adjust teaching strategies according to their
online learning behaviors.
Introduction
In recent years, learning analytics (LA) has emerged as a field aiming to provide solutions for questions related to teaching and learning with technology, such as the ways to explore online learning and get an accurate description of learning process (Larusson & White, 2014). For the purpose of understanding and optimizing digital learning and the environments in which it occurs, LA ideally attempts to collect and analyze data that exists in educational repositories such as LMS to assess the behavior of educational communities (Romero & Ventura, 2010). Researchers have synthesized the literature regarding the data analyzed in LA studies and found that log records of learners' interaction with and participation in LMSs was the main data source of LA. For example, Saqr et al. (2018) conducted a systematic review of six empirical studies on LA published before 2017 in the field of medical education. Results showed that most reviewed studies collected data from LMSs or online learning resources. Algayres and Triantafyllou (2020) conducted a scoping review of 49 articles on LA in flipped learning environments. They found that LMS data was the main data source. Log variables such as total login time, time spent on online activities, regularity and engagement were usually extracted from LMS log traces. The analysis of log data, also known as data logging, is a process of making sense of computer-generated records (logs). Log analysis has had extensive adoption in the field of LA for some time, and empirical implications have witnessed its potential for providing valuable feedback for improving the effectiveness of online education. More specifically, it helps instructors understand students' online learning behaviors (Breslow et al., 2013; Cooper & Sahami, 2013; Daradoumis et al., 2013), provide feasible feedback and to adjust instructional strategies (Dietz-Uhler & Hurn, 2013).
Note
The application of artificial intelligence (AI) in assessment has enabled a more continuous view of individual's ongoing engagement with an online learning environment, rather than discrete snapshots of performance provided by traditional assessments (Swiecki et al., 2022). AI techniques have been applied to different assessment tasks and evidence, such as electronic assessment platforms, stealth assessment, latent knowledge estimation and learning processes. By analyzing data generated from these approaches, previous research has investigated the following: test-taken behaviors (eg, time-on-task, answering and revising behavior during exams) (Lee et al., 2019), formative assessment using stealth methods (Yang et al., 2021), knowledge tracing (Molenaar et al., 2021) and analyzing multichannel data (eg, clickstreams, eye-tracking, mouse movements) in multimodal LA with different AI techniques such as process mining and network analysis (de Marcos et al., 2016; Saqr et al., 2020). A wealth of such research has made student academic performance analysis and prediction become two widely explored research topics in LA.
Log variables investigated in the previous studies can be divided into basic and elaborated types. Basic log variables are those extracted from raw log data and are not specific measurements of previously outlined concepts, such as simple frequency and time counts. This type of log variables (eg, the number of clicks, total time spent online) is the most typical measure used to predict student learning performance. For instance, total login time was found to be positively related to final course grade (eg, Conijn et al., 2017; Wei et al., 2015). However, researchers suggested to extract and aggregate meaningful and elaborated indicators from log data, rather than basic frequency measures of online events (Hadwin et al., 2007; Huang & Fang, 2013; You, 2016). Huang and Fang (2013) claimed that merely adding more basic variables does not improve the predictability of mathematical models. Therefore, researchers need to develop significant indicators that effectively capture online engagement. For example, the variable of regular study (ie, the degree to which a student consistently accesses the learning materials) was generated in some studies based on the notion that self-regulated learners show a typical characteristic of studying on a regular basis (eg, Conijn et al., 2017; Jo et al., 2015; You, 2016). Results in these studies showed learners who regularly logged into the LMS throughout the course showed better performance. Such elaborated time-based indicators can serve as leading factors of student access time and study patterns simultaneously (You, 2016). These indicators explain learners' sustained endeavors and awareness of their learning status better than either login time or login frequency. A similar log variable of distributed learning was examined in Theobald et al. (2018), which was a measure of the number of weeks in which each student had accessed the LMS irrespective of the actual amount of time students spent online. Higher values suggested a more distributed and continual engagement with the course content. It was found that distributed learning was associated with better exam grades.
Log variables can also be classified as generic variables (eg, total login time, total number of clicks) and course-specific variables generated from interactions with specific online activities required in course syllabus (eg, number of weeks of high engagement with summative exercises, weekly use of course videos for the pre-class activities). For better investigating the relationship between online participation and academic performance, some studies have used both kinds of variables into analysis (eg, Jovanović et al., 2019, 2021; Wei et al., 2015). For course-specific log variables, different learning designs used in the courses can potentially lead to different activities in LMSs thus resulting in different LMS usage. As a result, these course-specific predictors cannot be compared across courses. In the present review study, meta regression analysis was conducted only on generic log variables.
Many previous studies analyzed LMS data of one or only a few courses and learning tasks, which makes it difficult to compare study results and draw generalizable conclusions in the ways of using LMS data for predictive modeling (Conijn et al., 2017). Some studies performed prediction modelling on several courses and found that the effect of student LMS behaviors on students' learning performance differs across courses (eg, Conijn et al., 2017; Gašević et al., 2016). In Conijn et al. (2017)'s study, several log variables, such as the total number of views and clicks, had a positive relationship with students' grade in some courses while showed a negative relationship in others. These contradicting results may be explained by the fact that the courses differed in characteristics such as type, theme and learning design. For example, students taking fully online courses show more online interactions with LMSs compared with blended courses, which might have a great possibility of contributing to the effect of log variables on student academic performance. Furthermore, the dependent variable used in prediction models were not all the same. Some studies performed regression analysis to investigate the relationships between log variables and total course score (eg, Bravo-Agapito et al., 2021; Jovanović et al., 2021), while others used final exam score or post-test score (eg, Schumacher & Ifenthaler, 2021; Ulfa & Fatawi, 2021). Final exam score and post-test score are the one-time exams and tests which assess learners' knowledge acquired through the courses or learning modules. Total course score is the sum of all assessment parts of the course, which typically covers both final exam score (if there is) and the grade weights of the course design such as assignments, discussion forums, and quizzes. Therefore, the current study examines whether the predictive power of log variables on final exam score and total course score differs.
In the current empirical studies on LA, researchers investigated the predictive power of log variables in different learning contexts, mainly including learning type (fully online or blended), learning theme (eg, STEM, culture and arts), and the type of the dependent variable in prediction models (total course score or final exam score). Furthermore, the study characteristic variable of sample size that has been examined in many published meta-analysis articles was also considered in the current study. Therefore, a total of four potential moderators (ie, sample size, learning type, learning theme, the type of the dependent variable) would be examined in this meta-analysis. We aim to provide a review with meta-analysis of log variables that have been found to be significant predictors for student academic performance, compare the effect size of basic and elaborated, generic and course-specific log variables and investigate whether the effect size of generic log variables will change according to the four moderating factors.
RESEARCH SIGNIFICANCE AND OBJECTIVES
Improving academic performance is considered one of the crucial issues for education. In the existing literature, numerous studies have adopted LA approach to explore the relationships between log variables and student academic performance in the hope of providing guidance for instructors to make decisions. For example, instructors can encourage students in engaging online learning activities if they are less active during a longer period.
Recently, researchers have reviewed the literature to examine different aspects of applying LA to gain insights for monitoring student learning in digital environments, such as data sources, data analysis techniques, purposes and LA applications on some topics (eg, evaluation and assessment of student academic performance). Among them, several studies reviewed certain log variables used in predicting academic performance. For example, Namoun and Alshanqiti (2021) conducted a systematic literature review of 62 studies between 2010 and 2020 to investigate the applications of data mining and LA techniques in predicting student performance. Results showed that most studies employed regression and supervised ML models to predict student performance. Online engagement in learning activities, term assessment grades, and student academic emotions were the most evident predictors of learning performance. Ifenthaler and Yau (2020) reviewed 46 empirical studies published from 2013 to 2018 to investigate the effective role of LA in facilitating study success in the context of higher education. Results showed that one set of predictors for student success was variables extracted from online log traces which represented student online interactions and engagement, such as login frequency and submission of assignments.
Although some review studies found log data to be the main data sources of LA and summarized several log variables for predicting student academic performance, few studies further systematically provided a fine-grained summary of the influential log variables. Furthermore, despite the increase of LA research, there is no consensus to date on how LA might be implemented, eg, which data is useful, what different considerations have to be made regarding course characteristics, etc. (Agudo-Peregrina et al., 2014). It indicates that there is a need for further studies to investigate the issue of the generalizability of prediction models. Especially regarding the predictors, there is still a lack of comprehensive review of the log variables used in the context of predicting student academic achievement, especially, whether the effect of log variables on student academic achievement varies according to different learning contexts.
Thus, this study sets out to fill the gaps by providing a systematic review with a meta-analysis of log variables and their performance in predicting student academic achievement. In this regard, this paper investigates the studies from the body of research published in the most recent decade. The study aims to:
- Perform a systematic review of influential log variables and moderating factors (ie, sample size, the course type and theme, the type of dependent variable used in prediction models).
- Conduct meta-regression analyses on most frequently generic log variables and investigate whether the effect size of generic log variables will change according to the above mentioned four moderators.
- Compare the effect size of basic and elaborated, generic and course-specific log variables.
METHOD
This study employs a systematic review to provide a comprehensive examination of the log variables that have a significant impact on student academic achievement. We extracted the standardized regression coefficients of the statistically significant log variables in the prediction models to do a meta-analysis. The meta-analysis of standardized regression coefficients has the potential to yield a more accurate estimate of the effect of a predictor variable on a dependent variable after controlling for other variables that might also be related to the outcome variable (Fernández-Castilla et al., 2018). As previous studies involved two kinds of dependent variables in regression analysis, that is, continuous (assessment scores) and categorical (eg, pass/fail, student dropout), we only focused on the regression analysis of assessment scores. We use academic achievement to indicate assessment scores in the following analysis.
This systematic review is conducted based on the PRISMA (Preferred Reporting Items for Systematic Reviews and Meta-Analyses) framework proposed by Page et al., 2021. We systematically searched the empirical studies related to using log variables to predict student academic achievement. We used preselected keywords to search peer-reviewed scholarly studies through main electronic databases. The output of the research results created the primary collection of the studies which were then imported to Endnote, a reference management software. The metadata of the searched studies was extracted in the MS Excel worksheet. Then, the title and abstract of the studies were screened by two reviewers based on inclusion and exclusion criteria. Next, the full texts of the studies were evaluated based on the eligibility criteria.
Search strategy
We searched articles published from 2010 to 2021 on six databases that cover popular journals of interest in education and data science: Scopus, IEEE Xplore, ERIC, Web of science, ScienceDirect, and ACM Digital Library. The search was performed between November 2021 and December 2021.
The keywords are terms relating to LA (eg, log data, log analysis, educational data mining, learning analytics), and “assessing academic performance” (eg, assess*, student assess*, study success, learning performance, academic achievement). The keywords or the synonyms within each term were paired with Boolean operator OR and two terms of keywords were paired with AND. Because our main research objective is to examine the effect size of log variables in predicting student academic achievement, we used AND to add the keyword “regression OR coefficient” to Boolean expressions. An example search query was: (“learning analytics” OR “log data” OR “log analysis” OR “log file” OR “educational data mining” OR “log variable”) AND (assessment OR “educational assess*” OR “academic performance” OR “academic achievement” OR “study success” OR “academic success” OR “learning performance”) AND (regression OR coefficient).
Inclusion and exclusion criteria
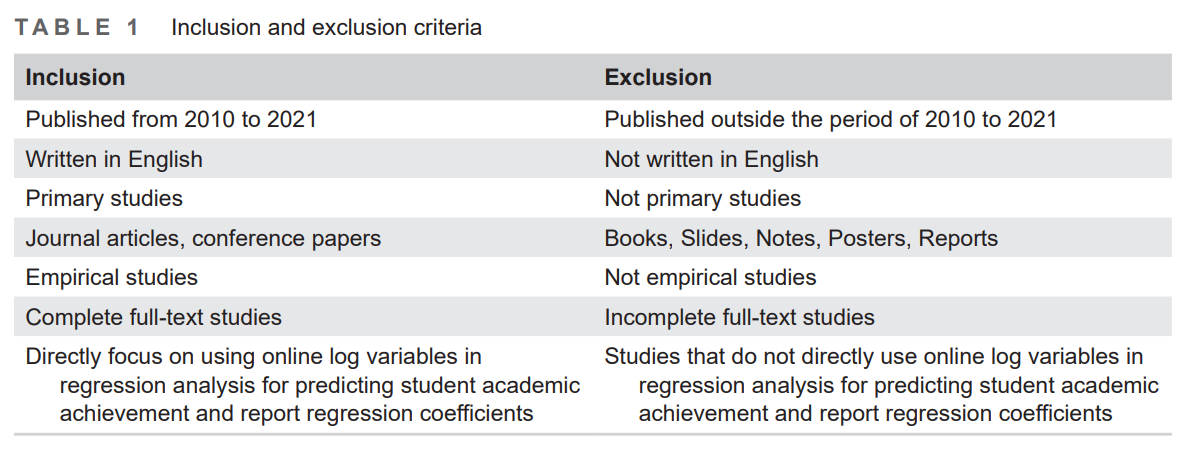
The summary of the inclusion and exclusion criteria is given in Table 1. The search process was limited to complete full text articles published on journals and conference proceedings from 2010 to 2021 and written in English. Other types such as notes and book chapters were excluded during the search process. Only empirical studies were included.
Selection process
Article selection process was carried out by following the recommendations from the PRISMA framework as shown in Figure 1. The search work output a total of 3717 articles from the six digital databases. Three hundred and eighty-nine duplicates were excluded in the first round of article selection process. In the second round, we removed 2984 studies that were not relevant to the setting or context of this review. Finally, in the third round, we excluded studies that did not meet the inclusion criteria (n = 256). This round involved the inclusion of related studies and exclusion of non-related studies according to these eligibility criteria: (1) Does the studies involve log analysis and regression analysis? (2) Is assessment score
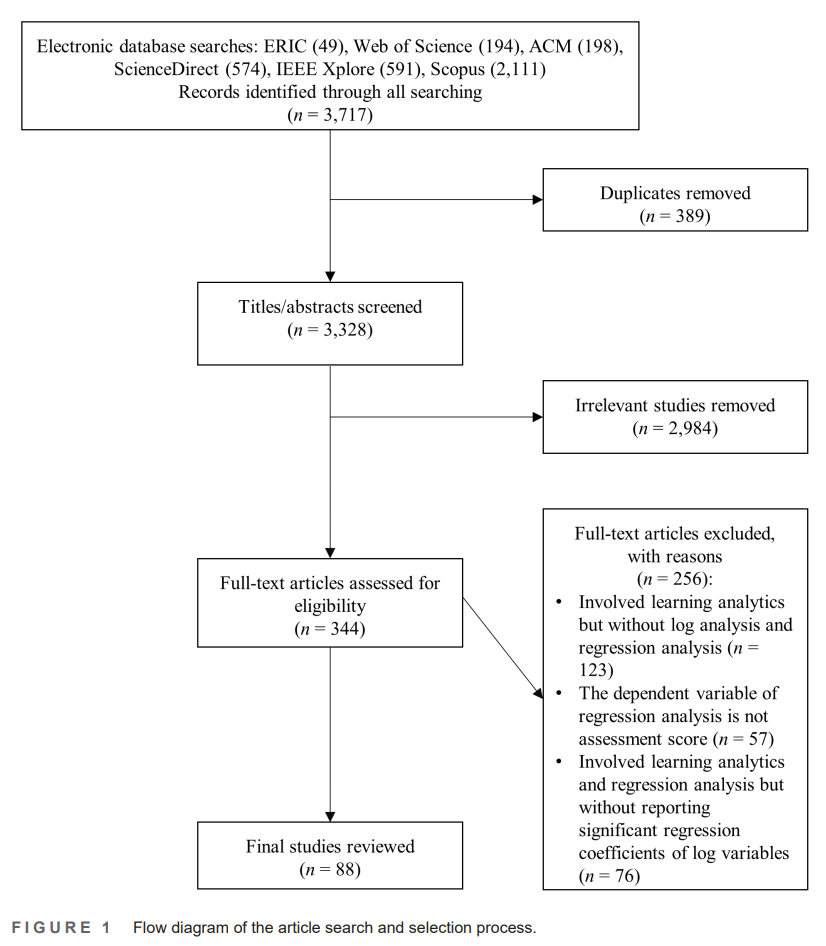
the dependent variable of the regression analysis? (3) Are the significant regression coefficients of log variables reported in the study? A total of 123 studies were eliminated from the selection as they did not perform log analysis or regression analysis. Then, 57 studies were excluded because their regression models were not used for predicting assessment scores. At last, 76 studies were excluded because no regression coefficients were reported. Therefore, 88 studies were kept from the final selection.
Data extraction and analysis
The final selection of the studies was examined by two reviewers for achieving the objectives of the study. The metadata of the selected studies was tabulated by using an Excel worksheet. The metadata includes author information, publication year, source title, conference rank and journal rank by Journal Impact Factor (JIF) and Journal Citation Indicator (if JIF is not available) (Clarivate, 2021) (Table 2).
Coding procedures
Outcome variable
We focus on the effect of log variables on student academic achievement. Therefore, the significant regression coefficients
Potential moderating variables
Four potential moderating variables were examined in the meta-analysis. These 33 studies were coded by two reviewers for these four variables.
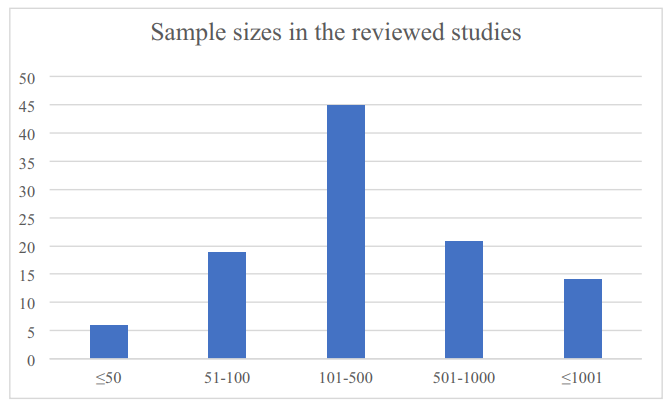
- Sample size. Sample size was coded as five ranges, “≤50”, “51–100”, “101–500”, “501– 1000”, “≤1001”.
- Learning type. The learning type was coded as “fully online” and “blended”.
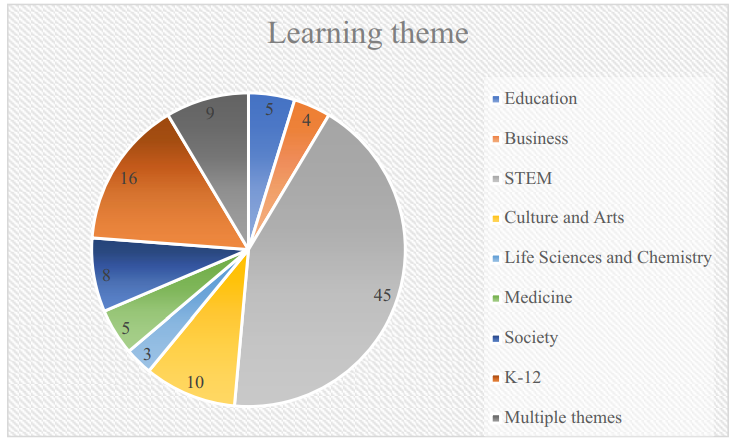
- Learning theme. The learning theme was coded as “Education”, “Business”, “STEM (Science, Technology, Engineering, Mathematics)”, “Culture and Arts (CA)”, “Life Sciences and Chemistry”, “Medicine”, “Society”, “K-12”, and “Multiple themes”. The code of “Multiple themes” means that some studies built a regression model by using log data from multiple courses.
- The type of the dependent variable. The type of the dependent variable was coded as “total score” and “exam score”.
Statistical analyses
The statistical analyses include two parts, meta-regression analysis of generic log variables and independent sample T test for testing the significant difference between the effect sizes of generic and course-specific, basic and elaborated log variables.
As course-specific log variables were measured differently across courses, we only performed meta-regression analysis on generic log variables. We used the package metafor in R to conduct the meta-analysis. The metafor package (Viechtbauer, 2010) provides functions for conducting meta-analyses in R and includes the required methods for conducting moderator analyses without limitations compared with other packages. Users can fit meta-regression models to examine the influence of one or more moderator variables on the outcomes. It can handle both continuous and categorical moderator variables. Furthermore, it includes functions for fitting fixed-effects and random-effects models.
The meta-regression analysis in the current study includes the following steps. Firstly, each regression coefficient was transformed into a standard normal metric, Fisher's Z score, as an effect size. Secondly, Cochran's Q-Test (Cochran, 1950) and the I2 statistic (Higgins et al., 2002) were used for the heterogeneity test. Heterogeneity in meta-analysis refers to the variation in study outcomes between studies. Cochran's Q is calculated as the weighted sum of squared differences between individual study effects and the pooled effect across studies, with the weights being those used in the pooling method. The I2 statistic describes the percentage of variation across studies that is due to heterogeneity rather than chance. I2 values of 25%, 50% and 75%, correspond to small, moderate and large amounts of heterogeneity among studies. Thirdly, the funnel plot and Egger regression test were used to test whether the results were biased due to different publication sources. Finally, moderator analyses were performed.
Log variables can be classified into generic and course-specific, basic and elaborated variables. We used independent samples T test to test whether the effect sizes of generic and course-specific, basic and elaborated log variables were significantly different.
A long table for sources, please read from the original source
RESULTS
This section reports the findings and discoveries by considering the research objectives of this review study.
Soundness and quality assurance of the dataset of the selected studies
Out of 69 journal publications and 19 conference studies, 78% of the studies are published in Q1 and Q2 ranking journals and A level conferences. This finding shows the soundness of the selected studies that all studies are thorough research by technology and analytical field. Table 2 shows that the highest number of selected studies that were published in one journal is 10, and they are published in Computers and Education, followed by Journal of Computer Assisted Learning, which provided 6 publications in the selected studies.
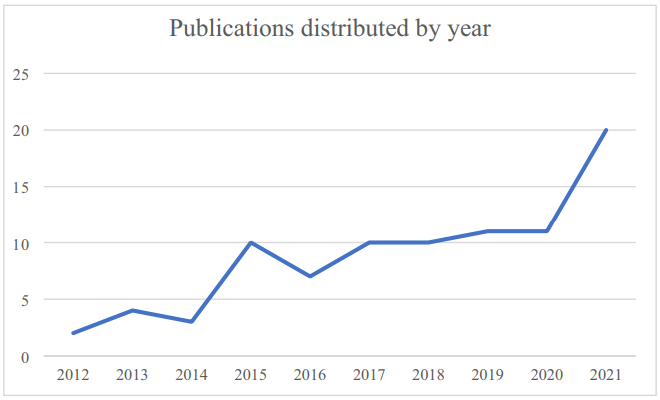
Distribution of the reviewed studies over time
The current review focused on studies from January 2010 to December 2021. Over that time, we noticed a gradual rise in the number of selected studies that met our research objectives. Figure 2 shows the highest number of studies published in 2021 (n = 17) and no studies that met our inclusion criteria published before 2012.
Sample size of the reviewed studies
Table 3 provides the sample size, the learning type and theme investigated in the reviewed studies. Figure 3 shows sample sizes of the reviewed studies. It reveals a great variation in recruitment. There was a total of 106 samples investigated in the reviewed studies. Most models (n = 45) were performed on a sample size of between 100 and 500. Some models (n = 21) were performed on a sample size of between 500 and 1000. It indicates that most reviewed studies have fairly large sample sizes, which enables researchers to validate the regression models with more solid evidence.
Learning type
We coded the learning type in the reviewed studies as “fully online” and “blended”. Typically, online learning is the use of web-based technologies to provide out-of-class learning in the absence of the physical classroom, which enables learning without time, place and pace constraints (Bernard et al., 2014; Chigeza & Halbert, 2014; Israel, 2015). It is launched through LMSs or virtual learning environments (VLE) such as Moodle and Blackboard. Blended learning refers to the integration of traditional face-to-face learning and online learning, which is seen as a way of combining the benefits of two formats (Adams et al., 2015). In the current study, we coded the course or learning task that integrated face-to-face class session and an online learning tool or platform as blended. As shown in Appendix A, apart from 4 studies that did not specify the course type, 44 courses or learning tasks investigated in the reviewed studies were delivered fully online, while the other 59 were blended learning.
Learning theme
Learning theme investigated in the reviewed studies can be classified into 9 groups as we mentioned in the previous section. Figure 4 shows that the highest number of courses or learning tasks were related to the field of STEM, followed by K-12 education.
The type of dependent variable in the regression models
We found that there were two kinds of dependent variables used in the regression models, total course score and exam score. We coded them as “total score” and “exam score”. Appendix B provides the information of dependent variables and log variables, and regression coefficients of log variables. There were totally 112 independent regression models, in which 68 models used exam score as the dependent variable.
The type of log variables in the regression models
A total 328 log variables were found to significantly predict student academic achievement. There are 161 generic and 167 course-specific, 236 basic and 92 elaborated log variables (Appendix B). It indicates that most studies investigated the frequency and time counts measures. Only a small number of log variables were aggregated and elaborated indicators.
A long table for variables, please read from the original source
Meta-regression analyses
We performed meta-regression analyses on 161 generic log variables. According to Fu et al. (2011), the sizes of the included studies should be at least 6 to 10 studies for a continuous study level variable; and for a (categorical) subgroup variable, each subgroup should have a minimum of 4 studies. Therefore, we summarized 12 log variables that were frequently found to be significant in the reviewed studies, including login time, login frequency, regularity of study time and interval, frequency of viewing course pages, number of clicks, average time per online session, time-on-task, number of online sessions, starting late, late submission and largest period of inactivity (Table 3). We conducted separate meta-analyses, one for each subgroup. Because the metadata of average time per online session shows only one level on all the moderators, we did not perform meta-regression on this log variable. Not all subgroups show differences on all the moderating variables. We only did meta-analyses on the moderating variables with varying levels.
Heterogeneity
Since each subgroup gets its own separate meta-analysis, estimates of the heterogeneity will also differ from subgroup to subgroup. When the number of studies in a subgroup is small, it is likely that the estimate of heterogeneity will be imprecise (Borenstein et al., 2009). Therefore, in practice, the estimate of heterogeneity is pooled across subgroups. The heterogeneity test results were
Publication bias
Figure 5 shows that all the 160 effect sizes of generic log variables are evenly distributed on both sides and gather at the middle and upper part of the plot. Some studies have statistically significant effect sizes (the gray areas), others do not (the white area). The Egger regression reveals no significant bias with z = 0.96 (p>0.05). Therefore, we can conclude that the results were not biased due to the publication sources.
Mean effect size
For login time, the integrated results show a significantly positive effect on student academic achievement (β = 0.17, z = 14.77, p<0.001, 95% CI = [0.15, 0.19]), which means students whose login time one standard deviation above the mean would have a grade that is 0.17 of a standard deviation above the average grade. For login frequency, the integrated results show a significantly positive effect on student academic achievement (β = 0.04, z = 2.53, p<0.05, 95% CI = [0.01, 0.06]), which means students whose login frequency one standard deviation above the mean would have a grade that is 0.04 of a standard deviation above the average grade. For regularity of study time, the integrated results show no significant effect on student academic achievement (β = −0.04, z = 25.31, p>0.05). For regularity of study interval, the integrated results show a significantly negative effect on student academic achievement (β = −0.28, z = −22.02, p<0.001, 95% CI = [−0.30, −0.25]), which means students whose standard deviation of study interval one standard deviation above the mean would have a grade that is 0.28 of a standard deviation below the average grade. For frequency on course pages, the integrated results show a significantly positive effect on student academic achievement (β = 0.29, z = 22.49, p<0.001, 95% CI = [0.26, 0.31]), which means students whose frequency on course pages one standard deviation above the mean would have a grade that is 0.29 of a standard deviation above the average grade. For the number of clicks, the integrated results show a significantly negative effect on student academic achievement (β = −0.27, z = −15.80, p<0.001, 95% CI = [−0.30, −0.23]), which means students whose number of clicks one standard deviation above the mean would have a grade that is 0.27 of a standard deviation below the average grade. For time-on-task, it shows a significantly positive effect on student academic achievement (β = 0.24, z = 0.03, p<0.001, 95% CI = [0.19, 0.29]), which means students whose time-on-task one standard deviation above the mean would have a grade that is 0.24 of a standard deviation above the average grade. For the number of online sessions, it shows a significantly positive effect on student academic achievement (β = 0.41, z = 22.24, p<0.001, 95% CI = [0.37, 0.44]), which means students whose number of online sessions one standard deviation above the mean would have a grade that is 0.41 of a standard deviation above the average grade. For starting late, the integrated results show a significantly negative effect on student academic achievement (β = −0.12, z = −11.94, p<0.001, 95% CI = [−0.14, −0.10]), which means students who start learning late one standard deviation above the mean would have a grade that is 0.12 of a standard deviation below the average grade. For late submission, the integrated results show a significantly negative effect on student academic achievement (β = −0.21, z = −9.91, p<0.001, 95% CI = [−0.25, −0.17]), which means students whose level of procrastination one standard deviation above the mean would have a grade that is 0.21 of a standard deviation below the average grade. For largest period of inactivity, the integrated results show a significant positive effect on student academic achievement (β = 0.14, z = 8.99, p<0.001, 95% CI = [0.11, 0.17]), which means students whose largest period of inactivity one standard deviation above the mean would have a grade that is 0.14 of a standard deviation above the average grade. The above results indicate that the moderator analysis was suitable for the log variables of login time, login frequency, regularity of study interval, number of clicks, frequency on course pages, time-ontask, number of online sessions, starting late, late submission and largest period of inactivity.
Key information
Moderator Analysis
| Variables | Effect to academic achievement | Description |
|---|---|---|
| login time | positive | students whose login time one standard deviation above the mean would have a grade above the average grade. |
| login frequency | positive | login frequency one standard deviation above the mean would have a grade above the average grade. |
| regularity of study time | no effect | |
| regularity of study interval | negative | Standard deviation of study interval above the mean would have a grade below the average grade. |
| frequency of viewing course pages | positive | frequency on course pages one standard deviation above the mean would have a grade above the average grade |
| number of clicks | negative | number of clicks one standard deviation above the mean would have a grade below the average grade. |
| time-on-task | positive | time-on-task one standard deviation above the mean would have a grade above the average grade. |
| number of online sessions | positive | Number of online sessions one standard deviation above the mean would have a grade above the average grade. |
| starting late | negative | Start learning late one standard deviation above the mean would have a grade below the average grade. |
| late submission | negative | level of procrastination one standard deviation above the mean would have a grade below the average grade. |
| largest period of inactivity | positive | students whose largest period of inactivity one standard deviation above the mean would have a grade above the average grade. |
The effect of the same variable has the different effect on different course, and the same situation happens on the dependent variables (Total score and exam score).
Moderator analyses
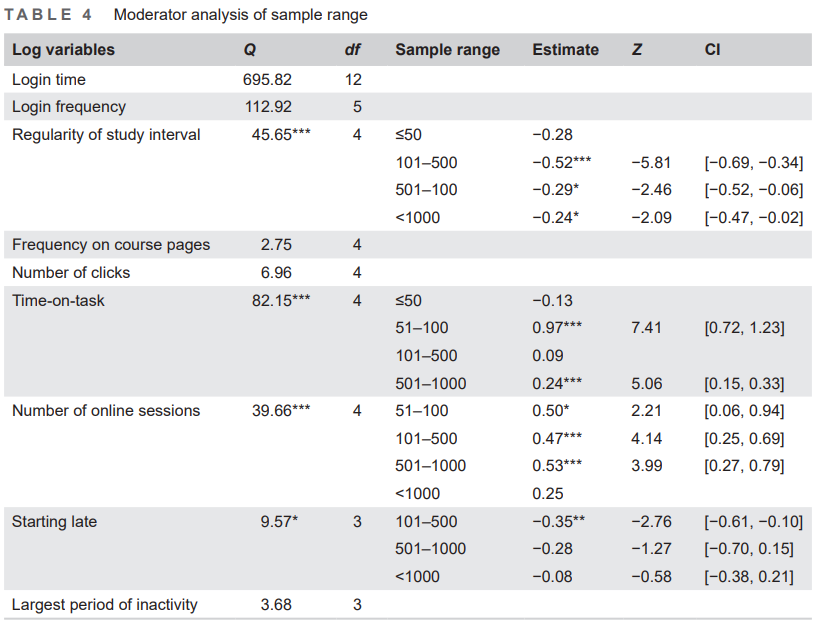
Sample range
As shown in Table 4, the moderator test of sample range was found to be significant in four log variables, including regularity of study interval (Q = 45.65, df = 4, p<0.001), time-on-task (Q = 82.15, df = 4, p<0.001), number of online sessions (Q = 39.66, df = 4, p<0.001), and starting late (Q = 9.57, df = 3, p<0.05). We can see that different sample ranges show significantly different effects on the effect size of these four log variables. It indicates that sample size has an unsteady impact on the regression analysis in the reviewed studies.
Learning type
Table 5 shows that the moderator test of learning type was only found to be significant in the log variable of regularity of study interval (Q = 29.89, df = 2, p<0.001). From Table 5, we can see that fully online learning shows a stronger effect on the effect size of regularity of study interval than blended learning (

Learning theme
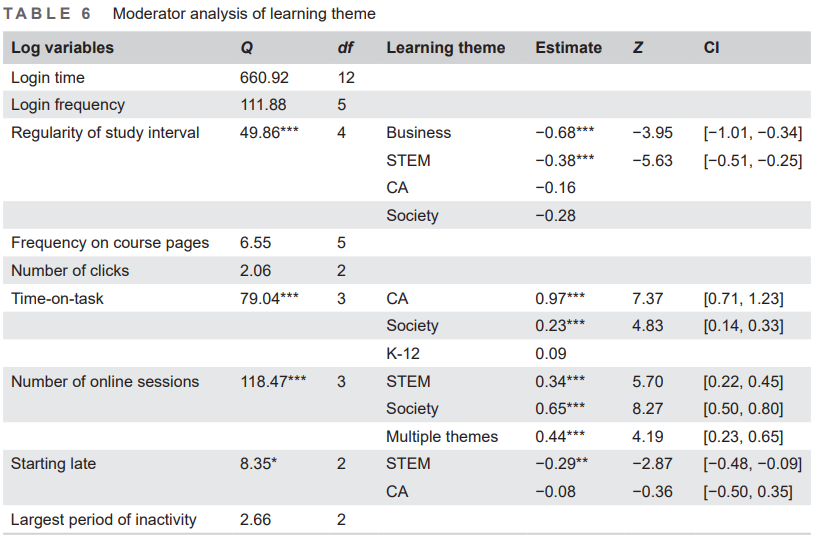
As shown in Table 6, the moderator test of learning theme was found to be significant in four log variables, including regularity of study interval (Q = 49.86, df = 4, p<0.001), time-on-task (Q = 79.04, df = 3, p<0.001), number of online sessions (Q = 118.47, df = 3, p<0.001), and starting late (Q = 8.35, df = 2, p<0.05). We can see that the courses or learning tasks in the field of business indicate stronger effect on the effect size of regularity of study interval (
Key Information
The effect of the same variable has the different effect on different course, and the same situation happens on the dependent variables (Total score and exam score).
The type of the dependent variable
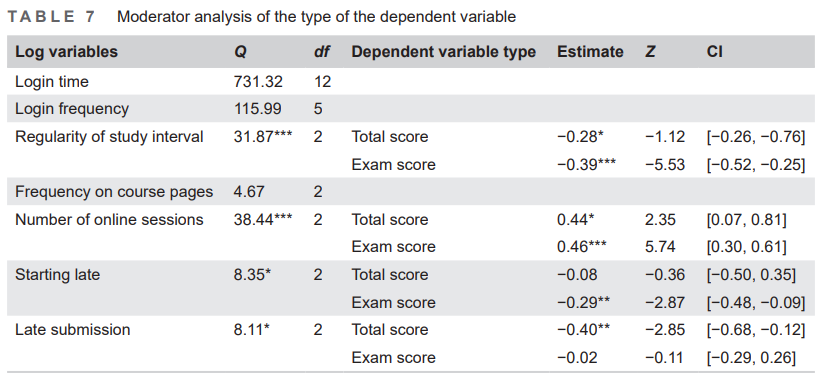
For the type of the dependent variable, Table 7 shows that the moderator test was significant in four log variables, including regularity of study interval (Q = 31.87, df = 2, p<0.001), number of online sessions (Q = 38.44, df = 2, p<0.001), starting late (Q = 8.35, df = 2, p<0.05), and late submission (Q = 8.11, df = 2, p<0.05). We can see that the type of dependent variable in the regression models significantly moderates the effect size of regularity of study interval (
T test on the type of log variables
The results of independent samples T test show that there is no significant difference between the effect size of the generic and course-specific log variables (t = −1.62, df = 291, p>0.05). Significant difference was found between the effect size of basic and elaborated log variables (t = 2.269, df = 100, p<0.001). We also calculated Cohen's D to examine the extent of the significant difference. The result was 0.33, which indicates a small effect.
DISCUSSION
As the first meta-analysis of the log variables in predicting academic achievement, this paper presents a synthesis of the effect sizes related to the log variables based on empirical research. Four potential moderators were examined (ie, sample size, learning type, learning theme, the type of the dependent variable), and the moderating effect was found to be different across different log variables. Furthermore, the effect sizes of different types of log variables were compared, in order to provide a deep understanding of how LA studies investigated log data.
Influential log variables
Based on the systematic review, we found that there is no wide variation in the learning type, the dependent variable of regression models, and the generic or course-specific log variables investigated in the reviewed studies. However, most reviewed studies investigated STEM courses and learning tasks. Furthermore, most log variables were generated from the basic frequency and time counts. Although only a small number of elaborated log variables were found to be significantly associated with academic achievement, the vigorous development of AI affords opportunities to improve the assessment of processes and enables the various possibility of the extraction and aggregation of log data: further calculation (eg, ratio, entropy), theory-driven LA-based variables (eg, regularity, procrastination), and network analysis-based variables (eg, density, centrality). Furthermore, variables are extracted from multichannel data, based on activities on not just LMSs but also AI-based tools (eg, e-book, video annotation application, notetaking, highlighting and bookmarks), which implies that promising directions for assessing learning processes are being developed with different AI techniques. The review results also show that the generation of some log variables varies across studies. For example, some studies investigated regularity of study time or regularity of study interval, which was calculated based on standard deviation. However, the log variable of regular study in the work of You (2016) was calculated based on the virtual attendance score. It indicates a lack of a uniform paradigm in generating complex log variables.
Among 12 generic log variables that were most frequently found to be significant in predicting academic achievement, most of them showed positive effects in some courses and learning tasks but negative in others. Only the positive effect of number of online sessions and negative effects of starting learning late and regularity of study interval were found in all the reviewed studies. A session was defined as the sequence of behavior from the first click after the login to the LMS until the last click before logging out, or the last click before staying inactive for at least 40 minutes (Conijn et al., 2017). The number of online sessions is a basic indicator that reflects student active interactions with the LMSs. Starting late is a measure of the time until the first activity, which is a more complex predictor relating to time management. Regularity of study interval is calculated by standard deviation of the study intervals. Therefore, this variable technically means the “irregular study”. It indicates that the association between log variables that reflect regular study and time management behaviors and academic achievement was steadier across different learning contexts. Positive effect of regular study on student learning has been confirmed in many studies (eg, Conijn et al., 2017; You, 2016). You (2016) pointed out that successful students would actively participate in their learning, such as regularly accessing online courses and completing assignments in a timely manner. Furthermore, previous studies also demonstrated the detrimental effects of starting to learn late on learning success (eg, Levy & Ramin, 2012; Michinov et al., 2011). Therefore, students who start the course early, regularly access the course and actively participate in the learning activities would be more likely to have a higher grade.
Moderator analyses
We performed a meta-regression on eleven generic log variables. Only regularity of study time was not suitable for the moderator analysis. The significant effect was found on other ten log variables. Mean effect sizes of these log variables show that login time, frequency on course pages, number of online sessions and largest period of inactivity positively impact student academic achievement, while starting late, regularity of study interval and late submission have a negative impact. Not all moderators influence the effect sizes of these log variables on all levels. For the moderator role of sample range, only regularity of study interval, time-on-task, number of online sessions and starting late are significantly moderated. For the learning type, it only significantly moderates the effect size of regularity of study interval. Students who regularly participate in fully online learning would have higher grades than studying blended courses. This result is logical because student academic achievement in fully online courses basically depends on how students perform online learning activities. The learning theme only significantly moderates the effect sizes of regularity of study interval, time-on-task, and number of online sessions, and starting late. The type of dependent variable in the regression models significantly moderates the effect size of regularity of study interval, starting late and late submission. These results suggest that the effect sizes of log variables relating to regular study, time management and active interactions vary across different courses and learning tasks. For building generalizable prediction models for multiple courses, more theoretical reasoning is needed to aggregate effective and meaningful log predictors that accurately reflect underlying concepts and can be widely applied, for exam ple, optimizing the measurements of regular study and distributed learning across courses based on learning theories and a more fine-grained disentanglement of learning content. In order to do so, we need to better understand what the measurements are actually measuring, what the effect is and how to translate it into specific measures of previously defined theoretical concepts (Conijn et al., 2017). This necessitates the introduction of theories into LA. As suggested by Gašević et al. (2015), Gašević et al. (2016), Wise and Shaffer (2015), theory-driven LA can help researchers gain more dynamic and replicable insights into the learning process rather than the static prediction of academic outcomes in a single case.
Difference in effect size
We found that there was no difference of the effect sizes between generic and course-specific log variables, while a significant difference between the basic and elaborated was found. Even though the generic and course-specific log variables have no significant difference in the prediction power, previous research has found that predictive models with only generic indicators were able to explain only a small portion of the overall variability in the students' course performance (Jovanović et al., 2019). It has also emphasized the quality of learning behaviors rather than the quantity of learning (Jo & Kim, 2013; You, 2015; You, 2016). As we mentioned in the previous section, theory-driven LA is needed for better conversion of log data into elaborated variables. For example, guided by the theory of self-regulated learning (SRL), You (2016) found that the variable of regular study was a more persuasive indicator than simple frequency measures. It further proves the crucial role theory plays in justifying selecting variables, developing models and interpreting results. Therefore, more complex variables based on well-defined theoretical frameworks warrants consideration.
LIMITATIONS AND FUTURE RESEARCH
Although the present review study provides insight into the effect of influential log variables on student academic achievement, there are still some limitations. First, we only focused on the statistically significant log variables in regression analysis. Future review studies can examine why some log variables were significant in some studies while insignificant in others. Second, not all categorical levels of some moderators were available in some generic log variables, which limits the meta-regression analysis. Future research could broaden the scope of the search to obtain more diverse metadata. Third, we did not examine the prediction for students at risk of failing a course or student dropout which deals with a categorical dependent variable. Further research can be conducted on this issue.
Regarding the direction of future research on predicting student academic achievement, most reviewed studies mainly examined frequency and time duration log variables. Additional elaborated indicators that reflect students' levels of engagement, motivation (eg, effort, persistence), and decision-making in online learning should be explored and tested in this field. This requires the integration of educational and learning theories and LA, such as, how well learners self-regulate their learning and how learners build connections with others. Furthermore, the application of AI in assessment brings a new set of challenges, for example, the sidelining of professional expertise in automated decision-making generated by AI approaches (Swiecki et al., 2022). Researchers can study on making AI-based assessments more explainable to the teacher for balancing between AI and teacher decision-making on teaching, learning, and assessment.
CONCLUSIONS
The present study reviewed 88 empirical studies on using log variables to predict student academic achievement. The main aim of this study is to explore the significant influential log variables and whether their effect size was moderated by factors reflecting different learning contexts. This research made three main contributions:
(1) presents a new perspective of the log variables, which provides a reliable quantitative conclusion of log variables in predicting student academic achievement;
(2) conducted subgroup analysis, examined four potential moderating variables, and identified varying degrees of moderating effect on several log variables including regularity of study interval, time-on-task, number of online sessions, starting late, and late submission;
(3) compared the effect of generic and course-specific, basic and elaborated log variables, and found significant difference between the basic and elaborated.
The findings help understand the role of log variables in predicting student academic achievement and make it clear that the effect size of certain generic log variables varies across the research contexts. For instructors, a depth understanding of log variables can help them obtain the continuous views of learners' engagement and infer student knowledge and learning in online learning, thus overcoming “one size fit all” approach and making appropriate decisions based on AI-based data outputs, for example, providing personalized teaching or remedial instruction for students. For researchers, the exploration of the effect size of log variables enables the generation of more robust log variables which best represent and reflect the true learning process of learners.
